
The Reporting area with the Job Statistics is created under the Monitoring menu item.
In the Job Statistics, statistics can be created for the respective job clusters.

Figure: Reporting → Job statistics area
The Cluster drop-down menu allows you to select one, several, or all clusters.
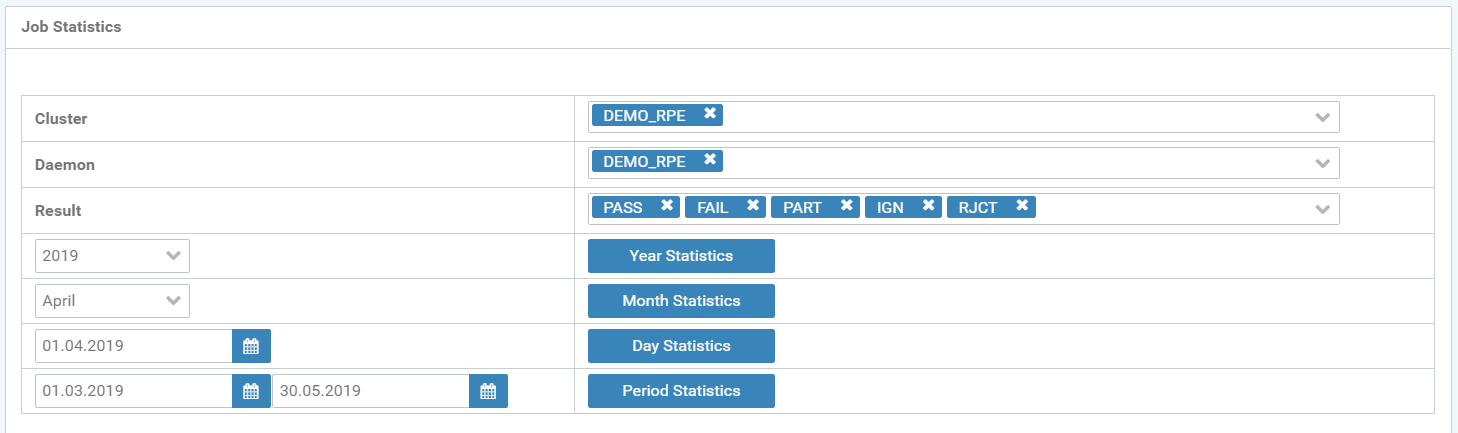
Figure: Job statistics
You can then use the drop-down menus to create the relevant annual, monthly, or daily job statistics.
-
The year selection is confirmed with Show year statistics.
-
The month with Show month statistics.
-
To create a day statistic, use Show day statistics.
The upper area of the statistics output shows the time range and color legend for the selected clusters. The graph shows the number of jobs (Y-axis) over time (X-axis).
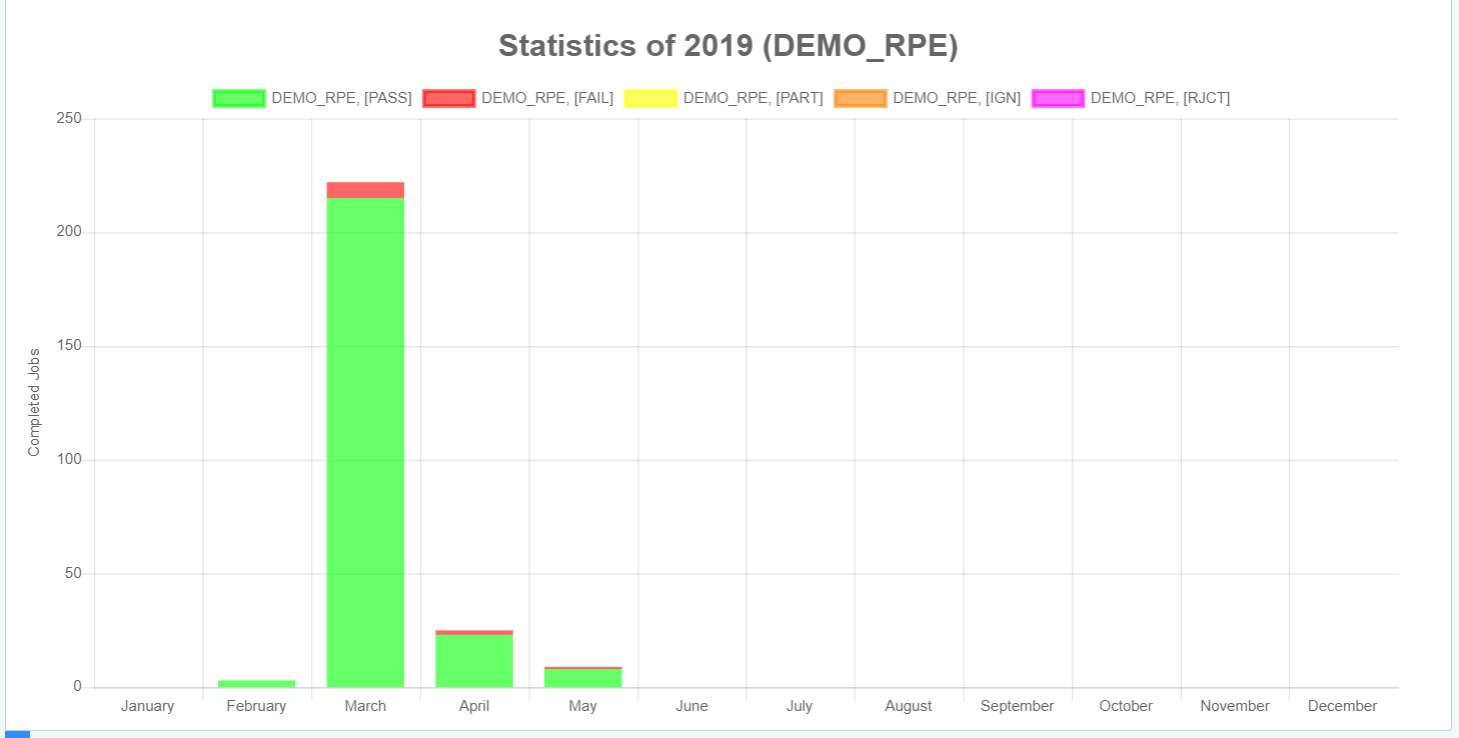
Figure: Job statistics (Year)
In Job results (Total) , a pie chart and a bar chart display the job results as a percentage of the total jobs evaluated.
The pie chart shows successfully completed jobs (PASSED).
A breakdown of the job results into:
-
PASSED
-
PARTIALLY
-
FAILED
-
REJECTED
-
IGNORED
is displayed as individual bar charts with the respective percentage values.
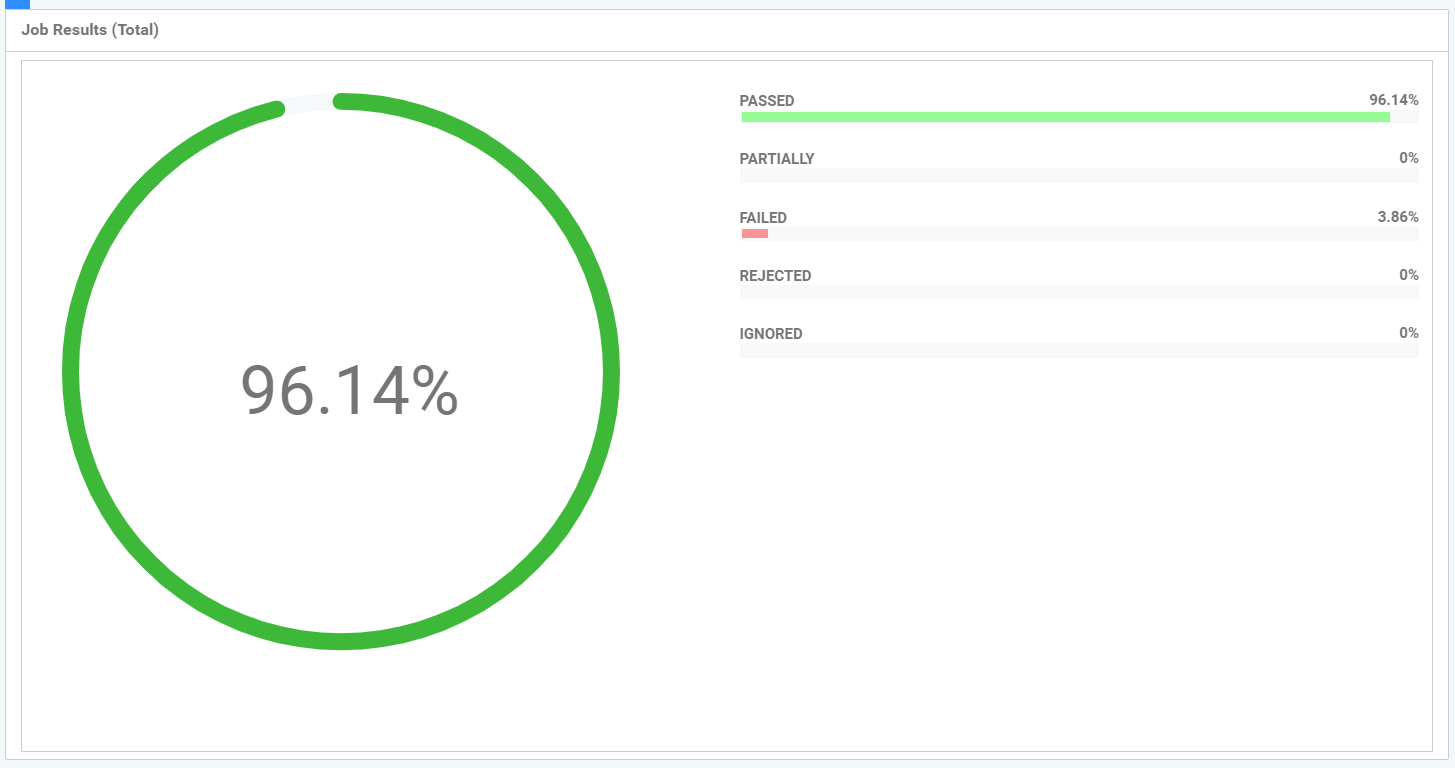
Figure: Job statistics, Results