
Reporting
Logging overview for important data.
The "Back to previous page" and "Refresh overview" icons are at the top of the screen.
You can filter according to the following criteria:
-
Displayed topics: e.g. Cluster manager, Scheduler
-
Time frame from / to
-
Displayed notification levels: e.g. INFO, WARN, ERROR
The "Apply filter" button starts the reporting filter.
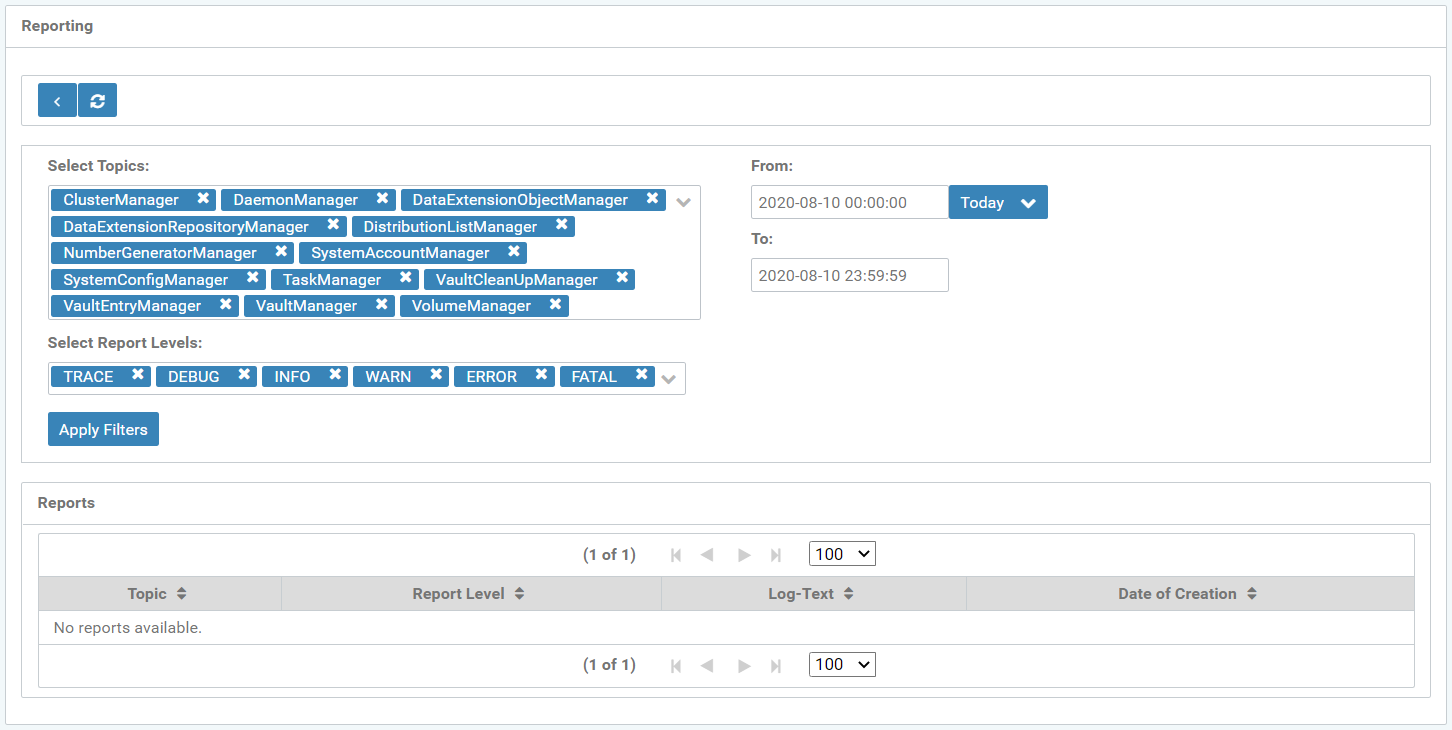
Figure: Monitoring - Reporting overview
Reports
Already created reports are displayed in a table
The columns are divided into
-
Topic: e.g. SystemConfigManager
-
Notification level: e.g. INFO
-
Notification text (optional)
-
Creation date
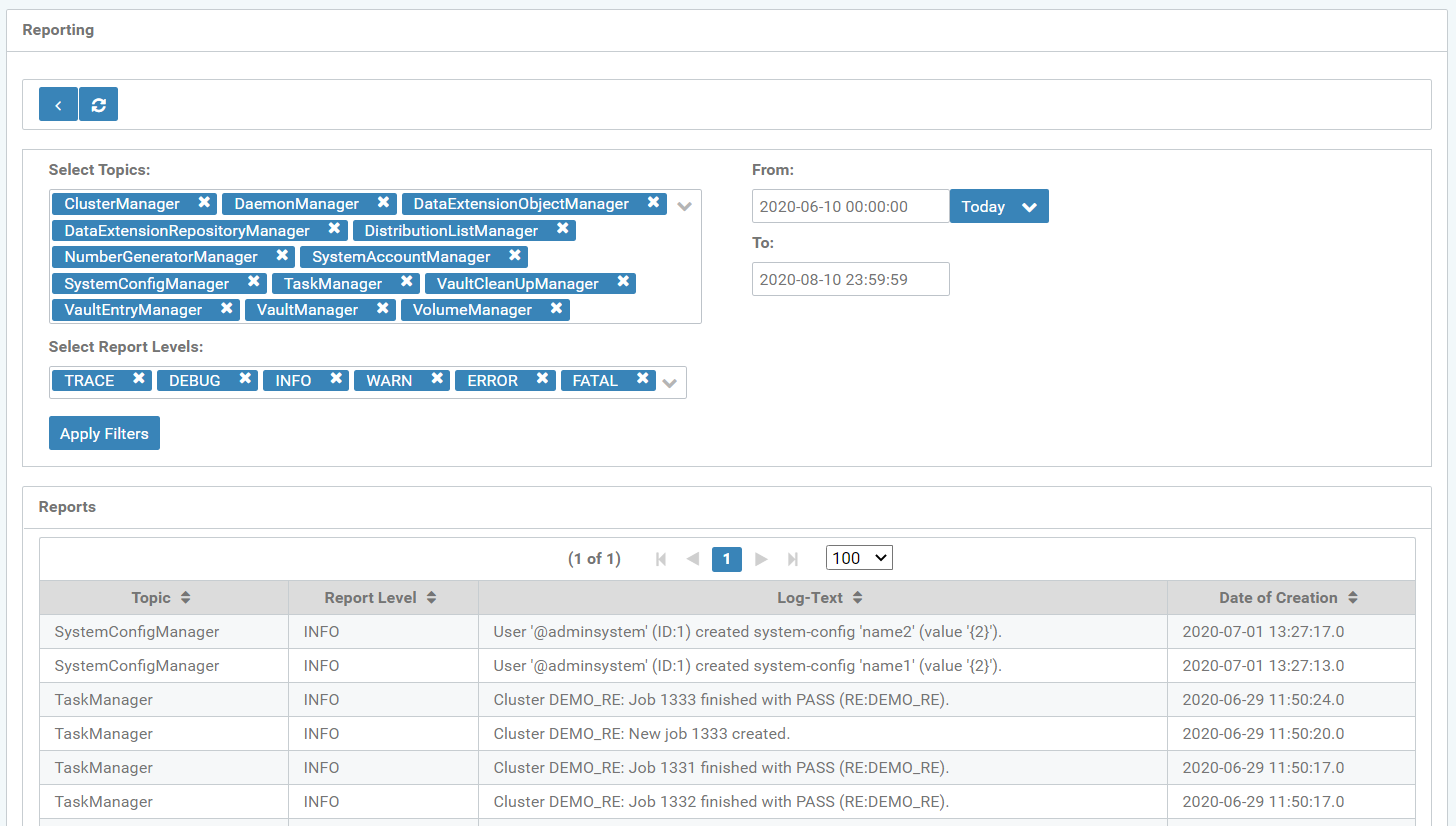
Figure: Monitoring - Reporting results
The table rows display in red, in case of an error message (ERROR).